New Local Plan - Issues & Options (Regulation 18)
5. Amount and Location of Housing Growth
5.1 Government policy requires plans to be an appropriate strategy taking into account 'reasonable alternatives' and based on proportionate evidence. Regulations also require us to assess 'reasonable alternatives' when producing spatial strategies such as the new Local Plan.
5.2 This consultation therefore contains alternatives/options for the scale and location of growth across the District over the proposed new Local Plan period 2020 to 2041.
5.3 This stage of the process is about the overall strategy, not specific development sites. The outcomes of this consultation and further evidence will then inform the Council's Preferred Strategy. It is possible that alternative or additional options could emerge, and the Preferred Strategy may be a hybrid containing elements from different options.
Housing Requirement
5.4 The starting point for determining the amount of housing we should plan for is to calculate our Local Housing Need using the Government's standard method, unless exceptional circumstances justify an alternative approach. Analysis undertaken in the Housing and Economic Needs Assessment (2022) does not point to any exceptional circumstances to depart from the standard method starting point for Harborough District.
5.5 Government policy says that, in addition to the local housing need figure, any needs that cannot be met within neighbouring areas (referred to as unmet need) should also be taken into account in establishing the amount of housing to be planned for.
5.6 Neighbouring Leicester City Council has an unmet housing need because it doesn't have sufficient land available in its area to meet its own housing need in full. In September 2020 the City published a Draft Local Plan for public consultation which indicated a potential unmet housing need of about 8,000 homes. Immediately after the consultation closed, Government increased the number of homes by 35% for the 20 biggest cities (including Leicester) to meet its national target to build 300,000 homes per year by the mid-2020s and help regenerate cities. This added a further 10,000 homes to Leicester's housing need between 2020 and 2036.
5.7 Providing for this number of additional homes in the City would have required more than a doubling of the housing allocations set out in their Draft Local Plan consultation. The City's evidence shows it will not be possible to meet their housing need and other Government policy obligations of a sound and deliverable plan. The latest version of the City's Local Plan indicates an unmet need of 18,700 homes to 2036. In this context, it is necessary to seek to agree a Statement of Common Ground to deal with this matter.
5.8 Government policy requires Harborough District to work with neighbouring authorities. To get a new Local Plan in place we have to demonstrate that our plan is, amongst other things:
- Informed by agreements, so unmet need is accommodated where practical to do so and consistent with achieving sustainable development.
- Based on effective joint working on cross-boundary matters (like the City's unmet need) that have been dealt with rather than deferred, as evidenced by a statement of common ground.
5.9 To meet Government requirements, the Leicester and Leicestershire authorities jointly commissioned independent consultants to prepare a Housing Distribution Paper setting out an evidence-led approach to apportioning Leicester's unmet housing need to neighbouring authorities including Harborough. This evidence informed a Leicester & Leicestershire Statement of Common Ground (SoCG) apportioning Leicester's unmet housing and employment needs to the surrounding Districts/Boroughs from 2020 to 2036.
5.10 The starting point for this work was each authority's Local Housing Need figure which for Harbough was 534 homes per year. Taking into account various factors, including the District's functional relationship with Leicester (migration and commuting) and the alignment of the number of jobs and homes, this evidence suggests Harborough's housing requirement should be increased by 123 homes per year to 657 homes per year to help meet Leicester's housing need.
5.11 Taking the above into account, three alternative options for the scale of housing requirement have been considered at this stage:
Option
Scale of Growth
Potential Housing Requirement (homes per year)
Justification
A
Low
534
Local Housing Need - Calculated using Government's Standard Method.
B
Medium
657
Local Housing Need plus a contribution of 123 homes per year towards meeting Leicester's unmet need
C
High
780
Local Housing Need plus 246 homes per year
Table 1 Options for the scale of housing requirement
Note: The Local Housing Need (LHN) for the District in the Housing Distribution Paper and Statement of Common Ground is 534 homes per year based on Government's standard method for calculating housing need and data published in 2022. Although more recent 2023 data has been published this does not significantly impact LHN for the District. The LHN figures used in the Housing Distribution Paper and Statement of Common Ground have therefore been used for consistency.
Housing Supply
5.12 To ensure the housing requirement is met, the new Local Plan will need to identify a supply of housing land to achieve this target. This means identifying a supply of homes greater than the requirement (known as a supply buffer or contingency) to ensure the housing requirement in the Plan is met in the event that something unexpected slows build rates over the next 15 years or so, such as economic factors or site-specific issues.
5.13 A decision on the scale of any supply contingency will depend on a number of factors and will be informed by the outcome of this consultation and further evidence. We are therefore interested in people's views on this. Examples nationally range significantly, but housing supply contingencies generally range between 5% and 25% above the housing requirement. At the time of its adoption in 2019, the current Local Plan contained a housing supply contingency of about 16%.
Scale of Housing Growth
Plan Period
5.14 A base date of 2020 for the plan period has been chosen for this consultation because it aligns with the Housing and Economic Needs Assessment (2022) and associated Housing and Employment Distribution Papers. An end date of 2041 is chosen because Government policy requires us to plan at least 15 years ahead from the date we adopt the new Local Plan which is currently scheduled for 2026 as per the timetable above.
Plan Period
Amount of Homes Remaining to be Planned
5.15 The amount of homes that need to be identified or planned for through the new Local Plan will largely be determined by the scale of annual housing requirement, the length of the plan period and the size of any housing supply contingency.
5.16 However, we already have a supply of homes that we can count towards meeting the amount we need to plan for in the new Local Plan. Our monitoring data shows we have a pipeline of 10,427 homes that have been built since 2020 or are already committed with planning permission/allocated in a plan.
5.17 To give some context of the scale of housing growth we may need to plan for, if we take the medium housing requirement of 657 per year (2020 – 2041) and include a supply contingency of 20% we would need to identify a total supply of 16,556 homes between 2020 and 2041. Assuming the pipeline of 10,427 homes are built before 2041 (including the two Strategic Development Areas at Scraptoft North and East of Lutterworth allocated in the current Local Plan 2019) we would need to plan for a further 6,129 homes – i.e. 6,129 homes on top of the 10,427 home pipeline.
Options for the Location of Housing Growth
Settlement Hierarchy
5.18 The Council has published a new Settlement Hierarchy Assessment to understand which of the District's settlements are the most sustainable. The settlement hierarchy does not set the level or distribution of development. Appropriate levels of development for settlements will be informed by the outcome of this consultation and further evidence which will feed into the next version of the Local Plan.
5.19 Government policy requires local plans to promote a sustainable pattern of development and play an active role in guiding development towards sustainable solutions, while taking local circumstances into account to reflect the character, needs and opportunities of each area.
5.20 As a large rural district, Harborough has approximately 100 settlements ranging from those adjoining the urban area of Leicester and market towns to very small villages and hamlets. The classification of towns, villages and rural settlements is therefore important.
5.21 Settlements in higher tiers of the hierarchy will often be more sustainable locations for new development due to residents being able to access a wider range of services and facilities more easily. Settlements work by providing a range of services for their residents and for a wider area. Typically, larger settlements have more services and serve a wider area.
5.22 The settlement hierarchy is being updated to form part of the evidence base for the new Local Plan. The current settlement hierarchy is set out in the Local Plan 2011-2031 (2019). The new assessment has allowed for a new approach to be taken in terms of the range of services and facilities audited and the categorisation of settlements so that they can continue to benefit and serve residents in both urban and rural areas.
5.23 The proposed settlement hierarchy is set out below:
Settlement Hierarchy Tier
Settlement
Adjoining Leicester Urban Area
Scraptoft/Thurnby/Bushby
Market Towns
Lutterworth
Market Harborough
Large Villages
Broughton Astley
Fleckney
Great Glen
Kibworth (Beauchamp and Harcourt)
Medium Villages
Billesdon
Great Bowden
Houghton on the Hill
Husbands Bosworth
Ullesthorpe
Small Villages
Arnesby
Bitteswell
Church Langton
Claybrooke Magna
Dunton Bassett
Foxton
Gilmorton
Great Easton
Hallaton
Leire
Lubenham
Medbourne
North Kilworth
South Kilworth
Swinford
Tilton on the Hill
Tugby
Walcote
Other villages/hamlets
Other settlements
Table 2 Proposed settlement hierarchy
Settlement Hierarchy
Question 10: Do you agree the proposed settlement hierarchy is appropriate? If not, how should it be changed?
Spatial Options for the Location of Housing
5.24 Taking into account the settlement hierarchy, six broad spatial options for delivering the three different scales of growth (Low, Medium, High) between 2020 and 2041 have been identified:
- Option 1: Local Plan Strategy
- Option 2: Proportional Growth
- Option 3: Urban Area Focus
- Option 4: Strategic Sites Focus
- Option 5: Market Town Focus
- Option 6: Large Village Focus
5.25 These options have been assessed through the Sustainability Appraisal.
5.26 For each option an indicative map has been produced below, to give a broad visual illustration of where new housing will be focussed under each spatial option between 2020 and 2041 – large circles indicate more housing growth and small circles indicate less. The size of the circle reflects the relevant housing requirement over the entire plan period. (Note: due to the scale of growth in medium and small villages the size of circle used for these settlements is the same).
5.27 To give an indication of the potential amount of housing that each option generates for each tier of the settlement hierarchy, a table shows the potential housing requirement 2020-2041 for each tier based on the medium scale of growth above (657 homes per year) with a 20% housing supply contingency added. Alongside this, the current pipeline of housing completions and commitments for each tier and the remaining amount of housing to be planned is also included.
5.28 The colour of each circle on the map reflects the colour of each tier of the settlement hierarchy in the table.
Option 1: Local Plan Strategy
5.29 This option is based on a continuation of the strategy in the currently adopted Local Plan 2019. It focuses significant growth towards the Market Towns in line with the current Local Plan strategy. Settlements adjoining the Leicester Urban Area and Large Villages accommodate a broadly similar level of housing growth overall, but due to the relatively low number of commitments in the Large Villages, the amount of additional homes to be planned/allocated in the new Local Plan would be higher than in the settlements adjoining Leicester.
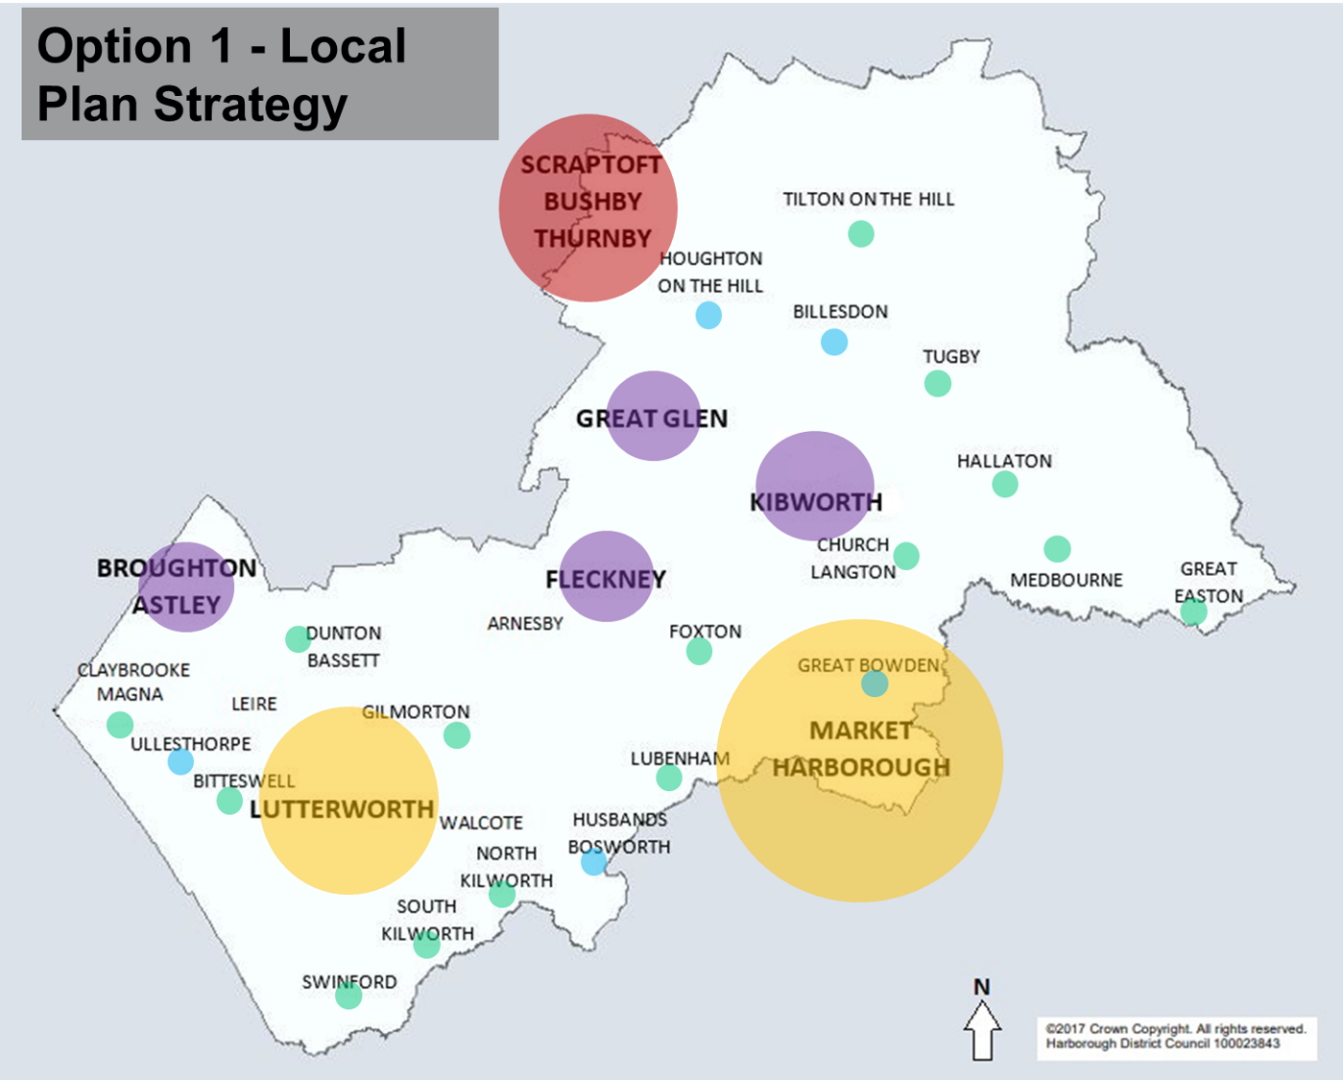
Figure 6 Option 1: Local Plan Strategy map
|
Settlement Hierarchy Tier |
Housing Requirement 2020-2041 (Option 1) |
Current Housing Completions/ Commitments |
Housing Remaining to be Planned |
| Adjoining Leicester Urban Area | 2,627 | 1,668 | 959 |
| Market Towns | 8,124 | 6,176 | 1,948 |
| Large Villages | 3,241 | 1,320 | 1,921 |
| Medium Villages | 865 | 355 | 510 |
| Small Villages | 1,110 | 703 | 407 |
| Other | 590 | 205 | 385 |
|
Total |
16,556 |
10,427 |
6,129 |
Table 3 Option 1 housing requirements by settlement hierarchy
Strengths
- Overall development would be directed to sustainable locations.
- It is less likely to be dependent on delivery of new strategic infrastructure (which could delay delivery) compared to some other potential options.
- The approach may present opportunities to improve existing infrastructure capacity.
- Services, facilities and businesses in existing sustainable settlements, including town and village centres, would be supported.
Weaknesses
- Sticking with the existing strategy may not respond to development capacity in all larger settlements or opportunities presented by strategic sites.
- This strategy may not make the best use of available land as it focuses on where growth has already been planned, meaning that the most appropriate sites may already be delivering, have planning permission or be allocated.
- The amount of new development close to Leicester is lower than the District's contribution to Leicester's unmet housing need.
- It may constrain the ability to respect or orientate growth to existing settlement form, delivering growth further and further away from town and village centres with potentially a strong reliance on car usage.
- The strategy may impact on existing Green Wedge and Area of Separation designations.
- The approach is based on whole plan figures which included a large amount of speculative development. Where certain settlements experienced high levels of speculative development prior to the Local Plan's adoption, this would be perpetuated.
Table 4 Strengths and weaknesses for Option 1
Option 2: Proportional Growth (Census 2021 household numbers)
5.30 This option is based on proportional growth. It spreads development according to the number of households in each settlement.
5.31 This option reduces the amount of growth in settlements at the top end of the hierarchy and increases growth at the lower end, particularly in the Medium Villages, Small Villages and Other settlements which see their highest levels of growth under this option compared to the other options. The key differences compared to Option 1: Local Plan Strategy is a significantly reduced role for settlements adjoining the Leicester Urban Area; a reduced role of Market Towns; and greater amounts of growth for the Large, Medium, Small and Other Villages/Settlements.
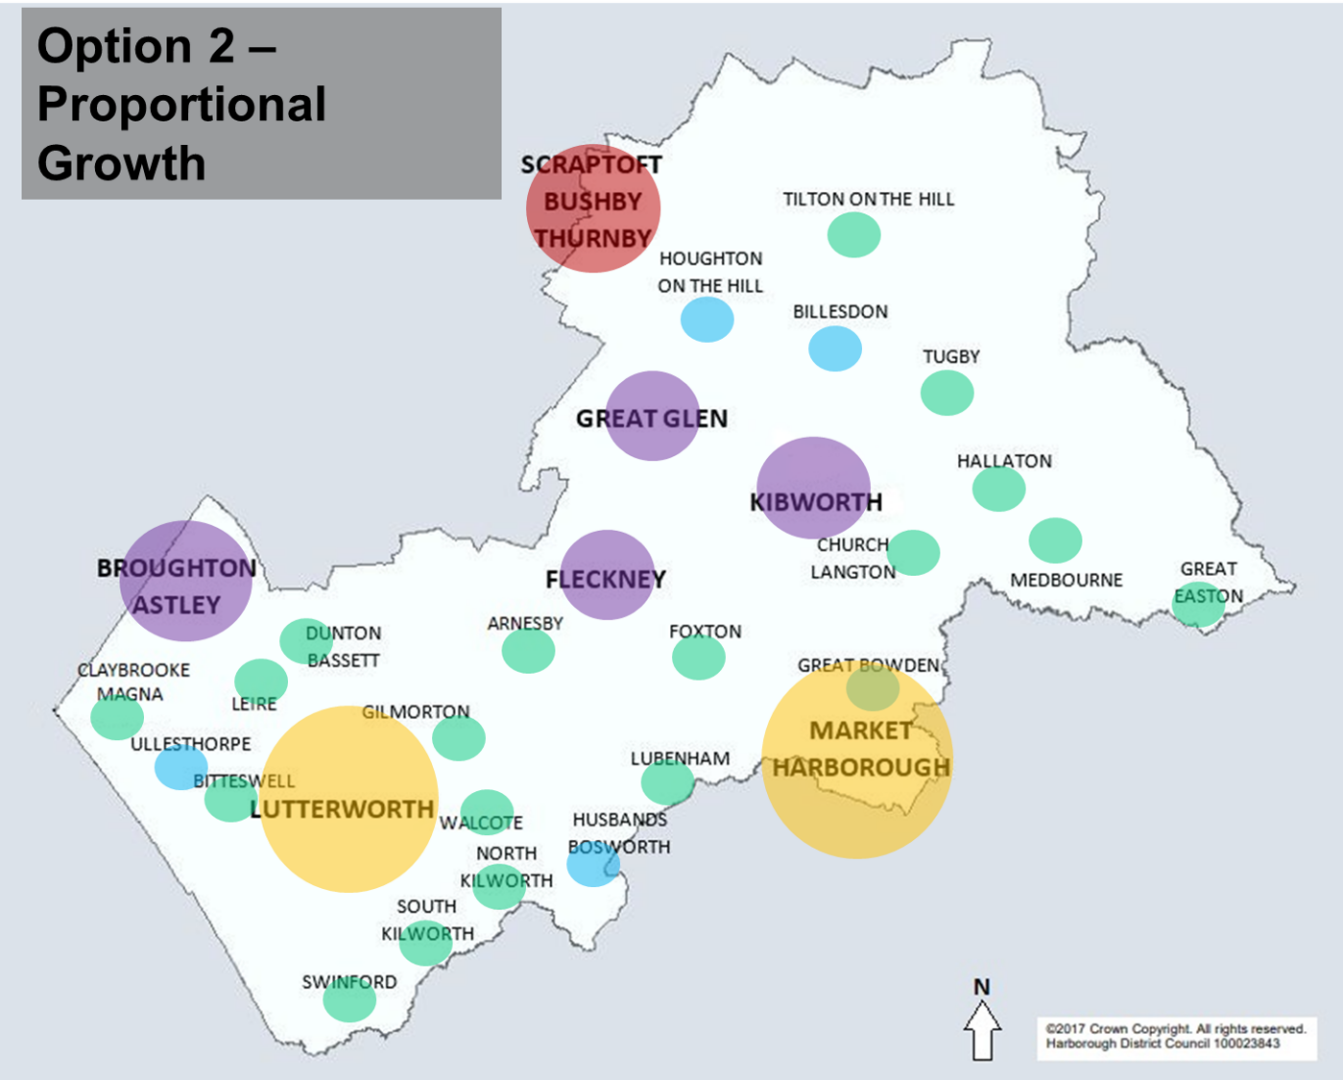
Figure 7 Option 2: Proportional Growth map
| Settlement Hierarchy Tier | Housing Requirement 2020-2041 (Option 2) | Current Housing Completions/Commitments |
Housing Remaining to be Planned |
| Adjoining Leicester Urban Area | 1,668 | 1,668 | 0 |
| Market Towns | 7,026 | 6,176 | 850 |
| Large Villages |
3,862 | 1,320 | 2,542 |
| Medium Villages | 1,026 | 355 | 671 |
| Small Villages | 1,619 | 703 | 916 |
| Other | 1,356 | 205 | 1,151 |
| Total | 16,556 | 10,427 | 6,129 |
Table 5 Option 2 housing requirements by settlement hierarchy
Strengths
- Under this option, the level of housing growth generally reflects the size of the settlements.
- The impact of growth is spread more evenly across the District.
- With development spread more across all settlements, the option could help sustain rural services and businesses.
- Development under this option could be perceived as a 'fair' distribution of housing growth.
- Given the spread of development, it would be well suited to fulfil NPPF requirement for 10% growth on small sites of 1ha or less.
- This option is more likely to sustain a steady rate of housing delivery than very large-scale growth focussed in one or two locations.
Weaknesses
- The option sees a high proportion of development in less sustainable tiers of the settlement hierarchy.
- With a relatively low proportion of growth adjoining the Leicester Urban Area, the opportunity to locate development in the most sustainable part of the District may be missed.
- Similarly, housing growth does not make the most of proximity to employment opportunities within the Leicester Urban Area.
- Given the spread of development under this option, it creates the greatest reliance on car and lowest opportunity to access sustainable transport.
- It may be challenging to support increased service capacity (e.g. school places, medical centres) due to dispersed nature of growth.
- Similarly, the option may not be most effective in delivering affordable housing in appropriate locations.
- This option has the most potential to affect the character of smaller settlements.
- It has the potential to exacerbate rural isolation unless public transport improvements become viable. In addition, growth is likely to be too dispersed to generate active travel opportunities.
Table 6 Strengths and weaknesses for Option 2
Option 3: Urban Area Focus
5.32 This option focuses development towards the District's most sustainable locations: the settlements adjoining the urban area of Leicester (Scraptoft/Thurnby/Bushby). Sites capable of accommodating more than 1,500 homes in Strategic Housing and Economic Land Availability Assessment (SHELAA) are not included in this option. They are considered through Option 4: Strategic Sites (see below).
5.33 This option seeks to focus as much growth as possible towards settlements adjoining the urban area of Leicester with lower levels of growth in the rest of the District.
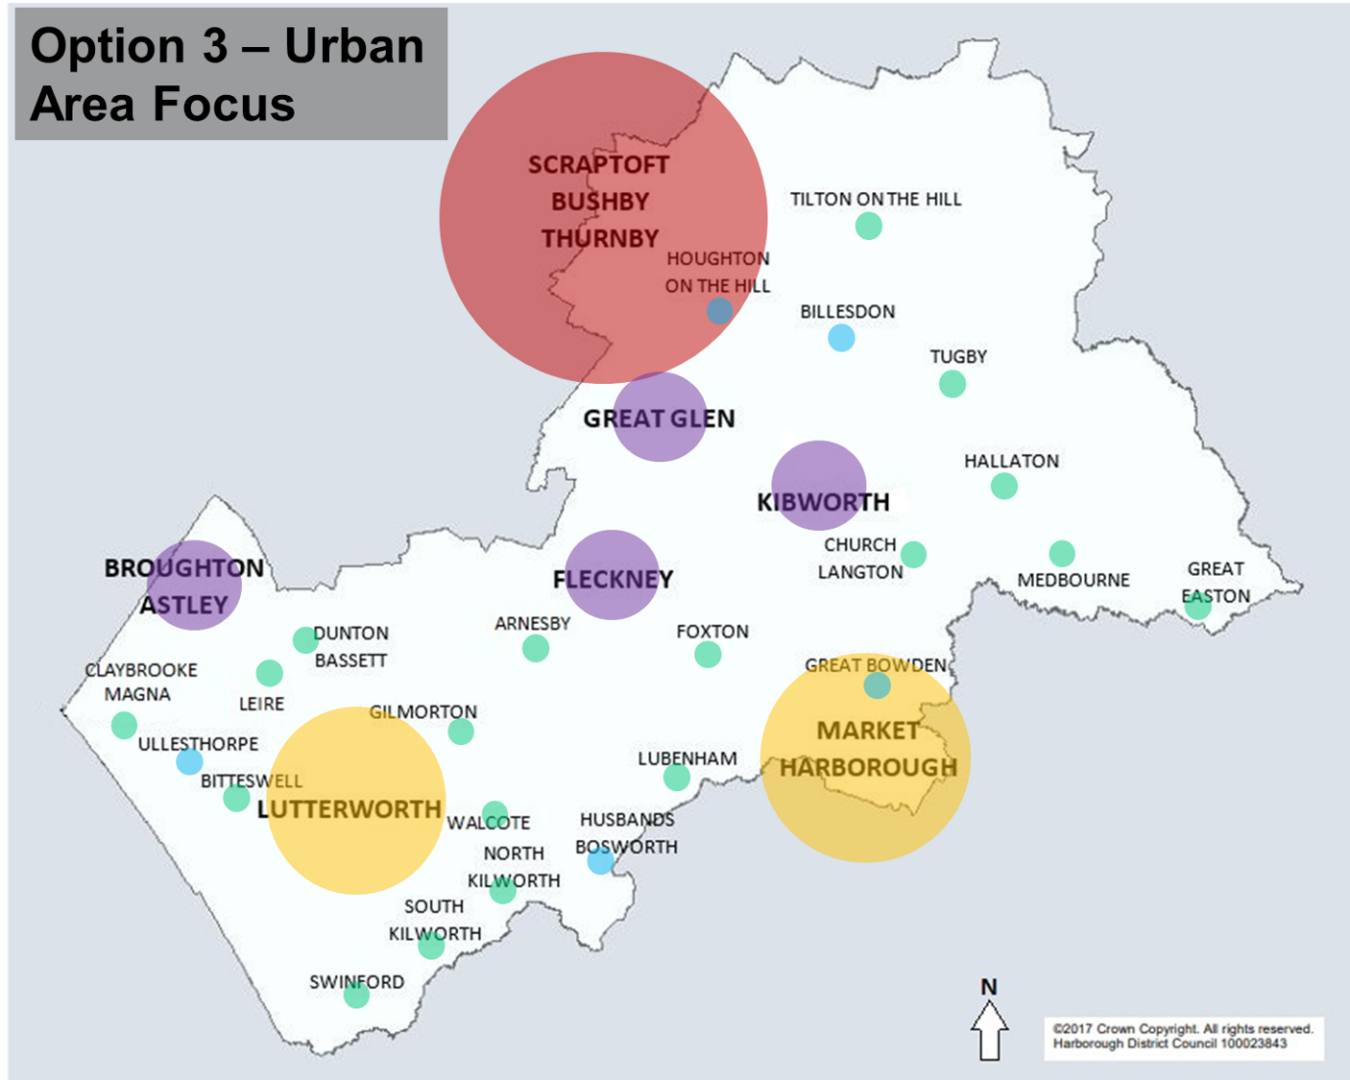
Figure 8 Option 3: Urban Area Focus map
| Settlement Hierarchy Tier | Housing Requirement 2020-2041 (Option 3) |
Current Housing Completions/Commitments |
Housing Remaining to be Planned |
|---|---|---|---|
| Adjoining Leicester Urban Area | 5,935 | 1,668 | 4,267 |
| Market Towns | 6,973 | 6,176 | 797 |
| Large Villages | 2,117 | 1,320 | 797 |
| Medium Villages | 593 | 355 | 238 |
| Small Villages | 734 | 703 | 31 |
| Other | 205 | 205 | 0 |
| Total | 16,556 | 10,427 | 6,129 |
Table 7 Option 3 housing requirements by settlement hierarchy
Strengths
- This option focuses growth on the most sustainable settlements (i.e. adjoining the Leicester Urban Area).
- This option would lead to shorter journeys to access jobs and services in the City and provide potential opportunities for sustainable transport improvements into Leicester.
- It maximises development opportunities in locations closest to the Leicester Urban Area and its wide range of higher order services, facilities and employment opportunities.
- Development close to Leicester responds to the District's contribution to Leicester City's unmet housing need.
- Growth in these settlements may improve the range and capacity of local services/facilities.
Weaknesses
- Settlements adjoining the Urban Area would have their highest levels of growth under this option which could impact on current Green Wedges and Area of Separation designations.
- In terms of employment, there is no existing economic centre in these settlements so there would be a reliance on new employment areas and/or improved transport links to the City.
- There may be a need for more small sites to come forward to fulfil requirement for 10% of allocations to be on sites of 1ha or less.
- By concentrating growth, the development potential within other sustainable locations may not be realised.
- Further development could exacerbate transport issues in the local area and into the City unless sustainable transport/active travel solutions are provided.
Table 8 Strengths and weaknesses for Option 3
Option 4: Strategic Sites Focus
5.34 This option focuses development towards large strategic sites capable of accommodating more than 1,500 homes in total from the Strategic Housing and Economic Land Availability Assessment. These large strategic sites are generally located around the South and East of the Leicester Urban Area and may require strategic infrastructure to be delivered. The sites are:
- Farmcare Estate, Stoughton (SHELAA site reference: 21/8229)
- Land at Stretton Hall Farm, Chestnut Drive, Great Glen (SHELAA reference: 21/8093)
- Land at Newton Harcourt (Newton Croft) (SHELAA site reference: 21/8178)
- Whetstone Pastures Garden Village, Willoughby Waterleys (part of a larger strategic site in adjoining Blaby District) (SHELAA site reference 21/8217)
- Land east of Broughton Astley and North of Dunton Bassett and Ashby Magna (SHELAA site reference: 21/8192)
5.35 This option seeks to focus as much growth as possible into large Strategic Sites, with less growth in the rest of the District.
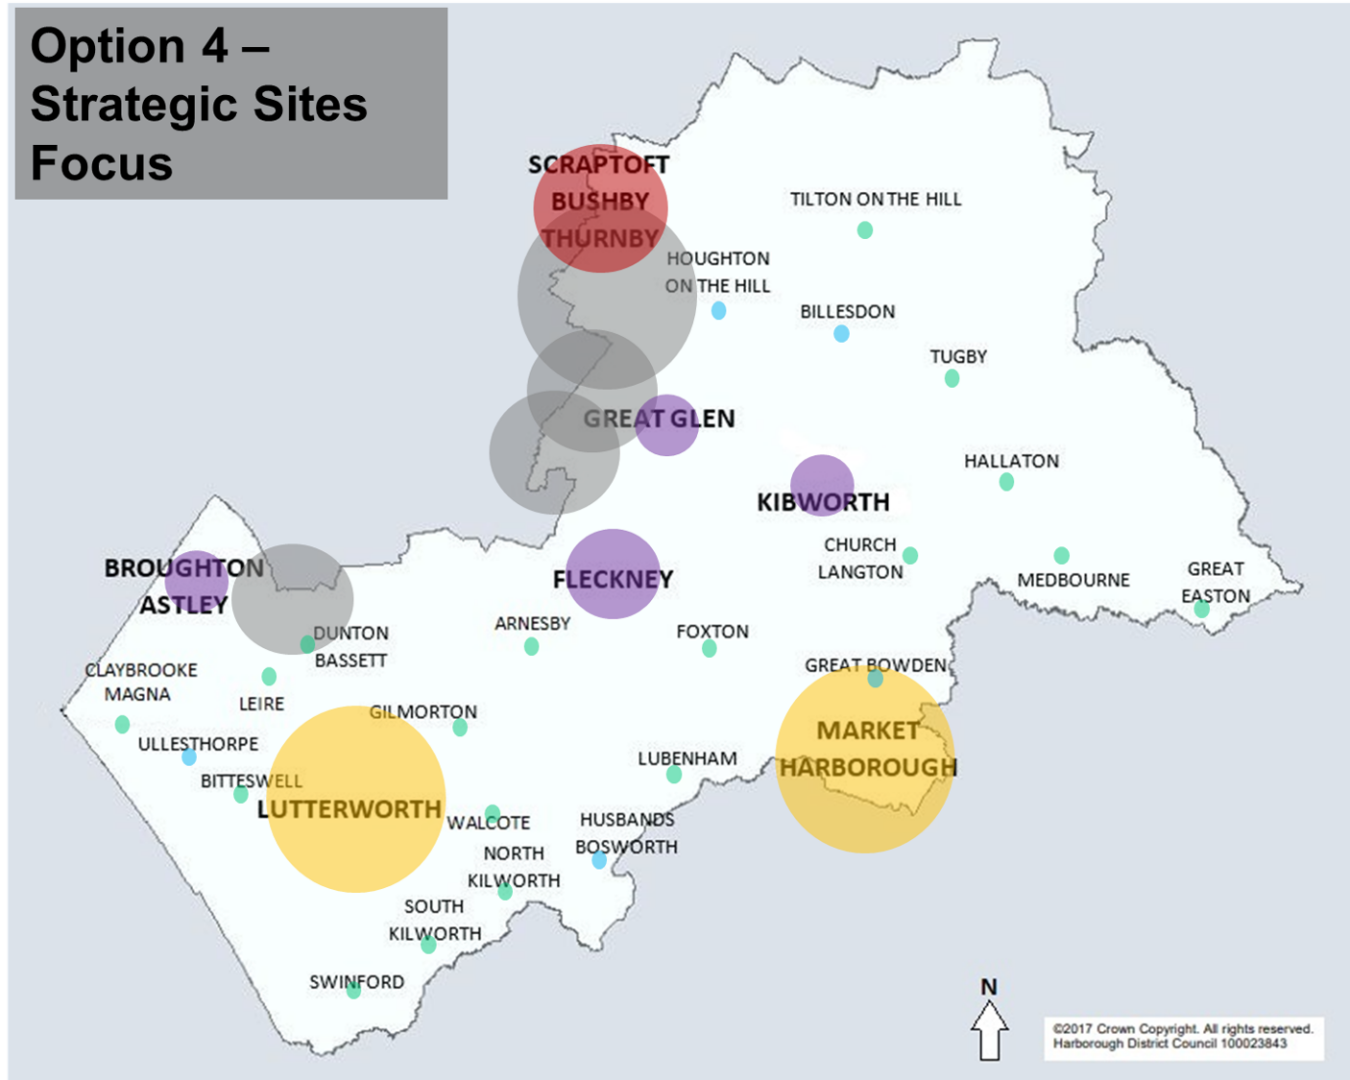
Figure 9 Option 4: Strategic Sites Focus map
| Settlement Hierarchy Tier | Housing Requirement 2020-2041 (Option 4) |
Current Housing Completions/Commitments | Housing Remaining to be Planned |
|---|---|---|---|
| Strategic Sites | 6,129 | 0 | 6,129 |
| Adjoining Leicester Urban Area | 1,668 | 1,668 | 0 |
| Market Towns | 6,176 | 6,176 | 0 |
| Large Villages | 1,320 | 1,320 | 0 |
| Medium Villages | 355 | 355 | 0 |
| Small Villages | 703 | 703 | 0 |
| Other | 205 | 205 | 0 |
| Total | 16,556 | 10,427 | 6,129 |
Table 9 Option 4 housing requirements by settlement hierarchy
Strengths
- In bringing forward strategic sites, this option would establish a strategy for subsequent plan periods to carry forward.
- It has the potential to deliver social benefits insofar as it would deliver Leicester's unmet housing need close to where it is needed.
- Strategic sites have a critical mass which could enable the delivery of strategic and local infrastructure (e.g. schools, healthcare, open space, sustainable travel) which helps internalise some of the more direct impacts development can have on existing areas and infrastructure.
- A focus on strategic sites presents the opportunity to plan comprehensively (placemaking) to create well designed places, with a focus on sustainability and active travel.
- There is an opportunity to ensure employment land is incorporated into these strategic sites resulting in the co-location of jobs and homes which could complement employment opportunities within the Leicester Urban Area and potentially reduce the need to travel.
- Further economic growth opportunities as a result potential new strategic infrastructure could emerge.
- The pressure for growth in other less sustainable settlements would be relieved particularly in the long term.
- This option is the most aligned with the Strategic Growth Plan.
Weaknesses
- There is uncertainty around timescales relating to strategic sites and how much development is deliverable within the plan period to 2041.
- Delivery of strategic sites can be vulnerable to delay, particularly in relation to provision of strategic infrastructure, including strategic transport infrastructure.
- With a focus on strategic sites, which typically have long lead-in times to deliver homes, it may be challenging to maintain supply of homes in the short/medium term across the District.
- No new development in other tiers of the settlement hierarchy beyond those already committed could impact on meeting local needs in the longer term.
Table 10 Strengths and weaknesses for Option 4
Option 5: Market Town Focus
5.36 This option focuses growth towards the Market Towns (Lutterworth and Market Harborough) with less growth in the rest of the District.
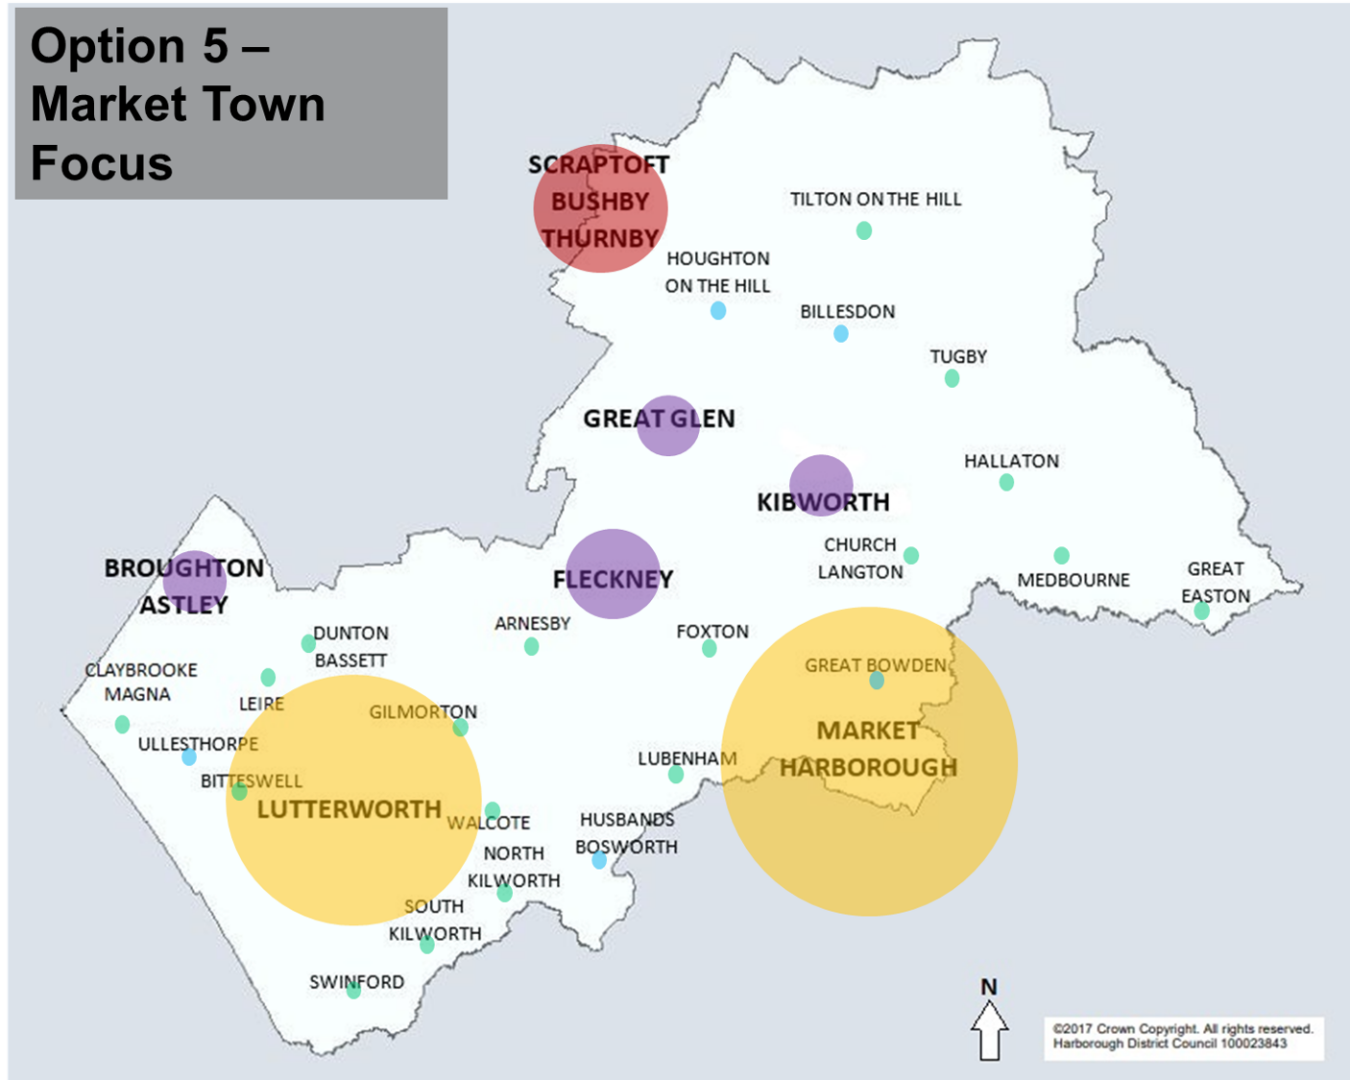
Figure 10 Option 5: Market Town Focus map
| Settlement Hierarchy Tier | Housing Requirement 2020-2041 (Option 5) |
Current Housing Completions/ Commitments | Housing Remaining to be Planned |
|---|---|---|---|
| Adjoining Leicester Urban Area | 1,668 | 1,668 | 0 |
| Market Towns | 12,305 | 6,176 | 6,129 |
| Large Villages | 1,320 | 1,320 | 0 |
| Medium Villages | 355 | 355 | 0 |
| Small Villages | 703 | 703 | 0 |
| Other | 205 | 205 | 0 |
| Total | 16,556 | 10,427 | 6,129 |
Table 11 Option 5 housing requirements by settlement hierarchy
Strengths
- This option has the potential to promote and deliver active travel alongside development.
- Development could support the long-term economic health and vitality of the District's two town centres.
- There may be an opportunity to alleviate pressure on Market Harborough town centre by providing more local services and facilities to north of Market Harborough (where most potential development sites are located).
Weaknesses
- Under this option there would be no additional planned growth adjoining the Leicester Urban Area which is the most sustainable part of the District.
- Potential allocations are increasingly distant from town centre, particularly in Market Harborough, and may not relate well to existing settlement form.
- Delivering the high and medium scales of growth to 2041 on appropriate sites in the two market towns would be challenging.
- Delivering this scale of growth in Market Harborough and Lutterworth would potentially impact on character of, and separation with, nearby villages.
- Achieving sustainable transport options and/or active travel solutions between new sites and existing town centre services may be difficult.
- With the focus on Market Towns, other villages may not be able to meet their local need for housing in the longer term and secure growth to support or improve local services/facilities.
Table 12 Strengths and weaknesses for Option 5
Option 6: Large Village Focus
5.37 This option focuses growth towards the Large Villages (Broughton Astley, Great Glen, Fleckney, Kibworth) with less growth in the rest of the District.
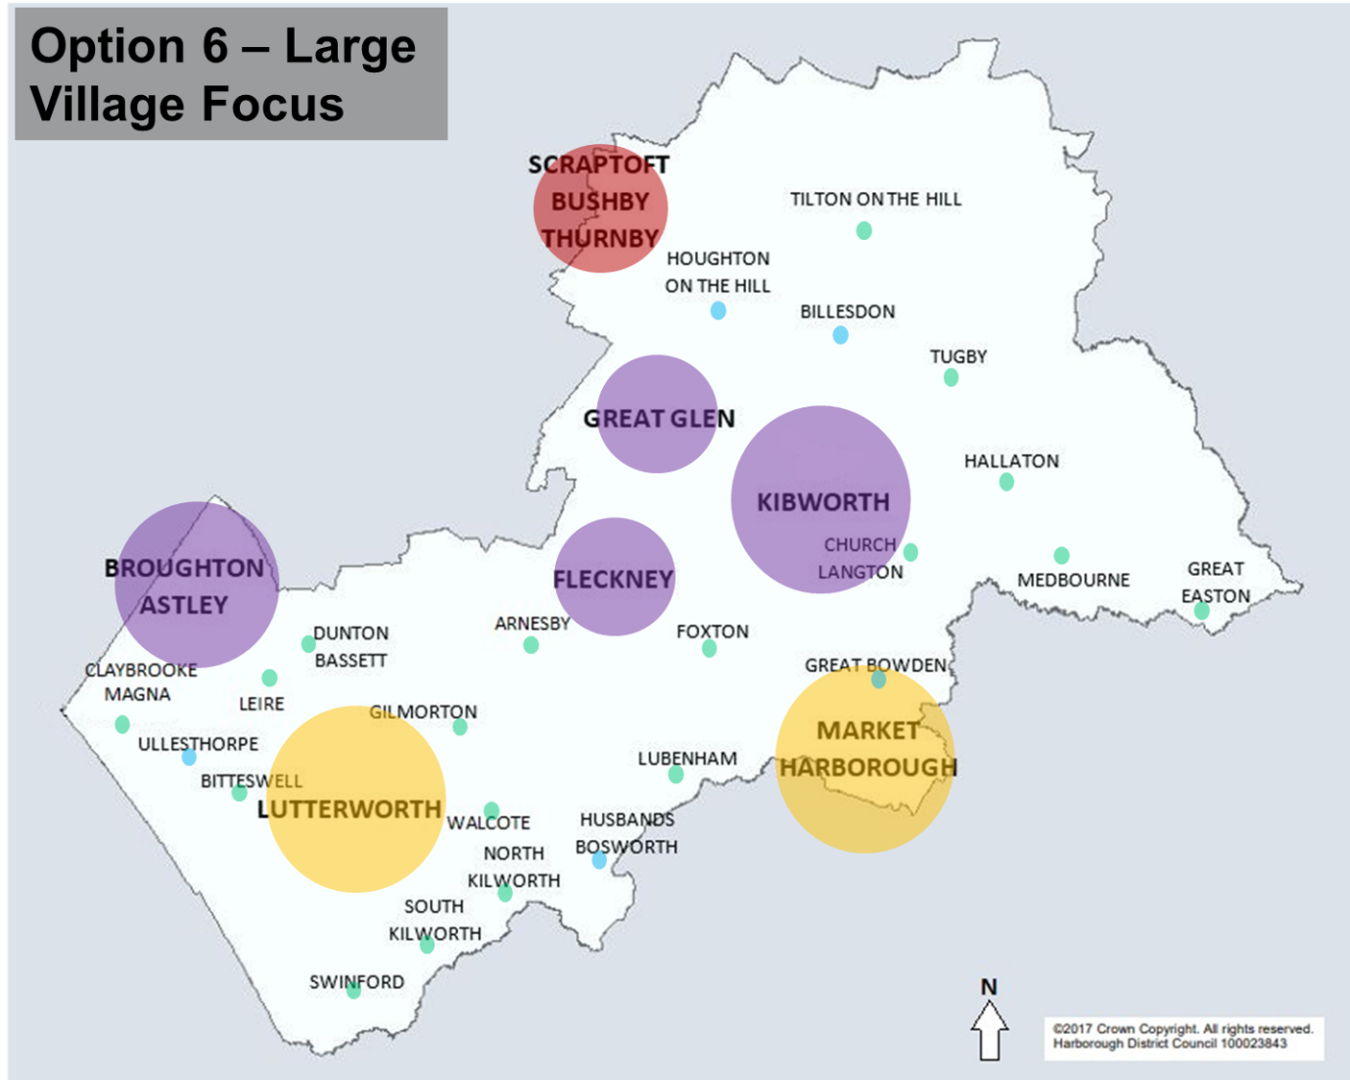
Figure 11 Option 6: Large Village Focus map
| Settlement Hierarchy Tier | Housing Requirement 2020-2041 (Option 6) |
Current Housing Completions/ Commitments | Housing Remaining to be Planned |
|---|---|---|---|
| Adjoining Leicester Urban Area | 1,668 | 1,668 | 0 |
| Market Towns | 6,176 | 6,176 | 0 |
| Large Villages | 7,449 | 1,320 | 6,129 |
| Medium Villages | 355 | 355 | 0 |
| Small Villages | 703 | 703 | 0 |
| Other | 205 | 205 | 0 |
| Total | 16,556 | 10,427 | 6,129 |
Table 13 Option 6 housing requirements by settlement hierarchy
Strengths
- The considerable housing capacity of potential sites within the Large Villages would be maximised.
- The option would support existing and, potentially, the delivery of new infrastructure, services and facilities in Large Villages which act as services centres for lower order settlements.
Weaknesses
- Under this option there would be no additional growth beyond existing housing completions and commitments in more sustainable settlements.
- The potential for housing growth within more sustainable locations would not be realised.
- By locating growth in Large Villages, access to most higher order services would involve travelling to Market Towns and the Leicester Urban Area and encourage use of the private car.
- By spreading growth over the four Large Villages, the benefits of large scale or strategic growth may not be realised.
Table 14 Strengths and weaknesses for Option 6
Housing Spatial Options